Availability of high-quality data on the time and location of major crimes in the city of Baltimore makes studying the characteristics of such crimes a data scientist’s delight. I have used a 12-year long dataset spanning from Jan-2011 to Dec-2022 (updated from the time of posting) to explore trends and patterns of violent crimes within the city, and also developed a model to predict crimes on any given street or in a neighborhood.
I have considered assault, robbery, shooting, rape and homicide as violent crimes, and ignored others such as larceny and theft. For simplicity I have combined different subcategories (commercial/carjacking) of robbery into a single “robbery” category, and aggregated/common assault into one “assault” category. Here I discuss major findings from the data itself. In the next post I talk about model development and predictions.
Yearly trends, 2011-22
A Baltimore Sun report using 5-year data from 2012 to 2017 showed a dip in violent crimes in the year 2014, followed by a sharp upswing through 2017.

Not surprisingly, my findings above confirm this trend, showing a 36% rise in all crimes over the 3-yr period between 2014-17. What is interesting though, is the seesaw that followed right after 2017, starting a 20% downswing over the next 3-yr period through 2020, followed again by a 11% upswing over the next 2 years. The latest increase is within 95% confidence interval (shaded band) around the smoothed trend line that is still going down, but two points to note here: first, smoothed lines lag actual trend in the data, and second, this line is already showing signs of flattening. More importantly, any uptrend in crimes in recent years is worth keeping an eye on, given the hardships of especially poorer communities during COVID era.
As the second plot above shows, these ups and downs are driven primarily by two major types of crime, assault and robbery, which together contribute to >90% of all violent crimes (assault alone accounts for 70%). Over the same three swing periods, assault rose 25%, fell 12% and rose again 12%, whereas robbery showed stronger trends – up 59%, down 42% and up 14%. Among the three “smaller” crimes, shooting rose sharply, 90%, from 2014 to ’17, and seems to have plateaued afterwards. Homicide and rape numbers also suggest a stabilizing trend in recent times.
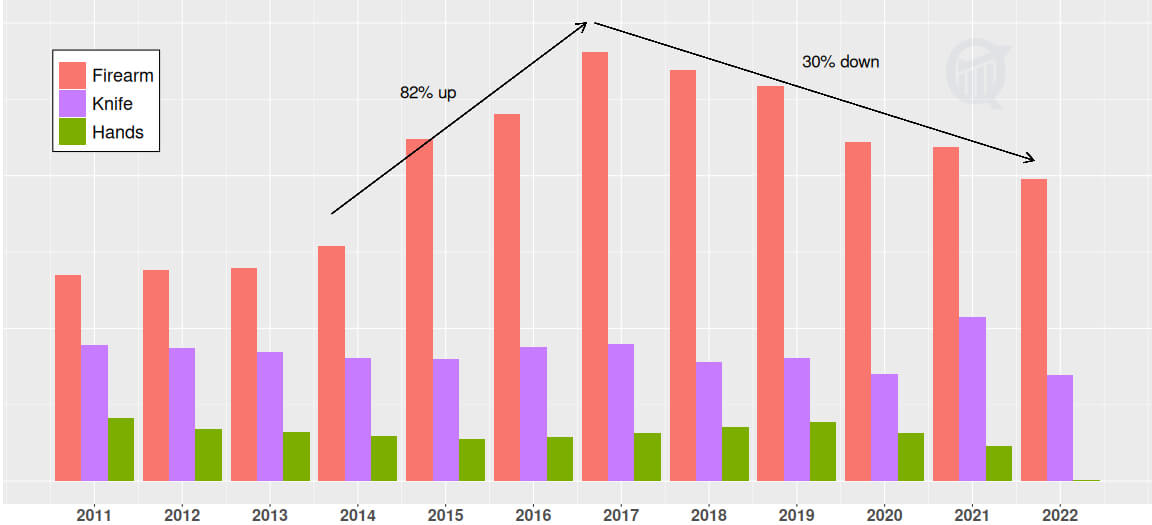
Major types of weapon used in committing violent crimes from year 2011 to 2022 are shown below. For simplicity I have combined different firearm subcategories (firearm/handgun/rifle/automatic firearms etc) into a single Firearm category.

Firearm use spiked 82% from year 2014 to 2017, likely due to the prevalence of guns on streets as noted before. By contrast, there was a slower, but still significant, 30% drop in gun-related violence over the next 5 years through 2022. Crimes committed with knifes stayed more or less stable throughout the entire time.
Crime distribution in space
Studying swings and trends in time gives valuable information, but crime happens in space – streets, parking lots, neighborhoods and such. To understand the spatial distribution of violent crimes within the city area, and how it compares across different times, I looked at four specific years: the “down” year 2014, the “peak” year 2017, next down year 2020, and year 2022 (recorded ~2000 more violent crimes than in year 2020).
Neighborhood crime by numbers:
The sortable table below lists all neighborhoods by total crime activity and % changes over these years.
| Neighborhood | 2014 | 2017 | 2020 | 2022 | %('14-'17) | %('17-'20) | %('20-'22) |
|---|---|---|---|---|---|---|---|
| Downtown | 610 | 687 | 648 | 812 | 13% | -6% | 25% |
| Frankford | 414 | 540 | 460 | 481 | 30% | -15% | 5% |
| Brooklyn | 267 | 537 | 316 | 390 | 101% | -41% | 23% |
| Belair-Edison | 341 | 502 | 388 | 425 | 47% | -23% | 10% |
| Sandtown-Winchester | 338 | 481 | 398 | 332 | 42% | -17% | -17% |
| Cherry Hill | 252 | 403 | 254 | 297 | 60% | -37% | 17% |
| Upton | 245 | 349 | 270 | 365 | 42% | -23% | 35% |
| Central Park Heights | 251 | 340 | 200 | 238 | 35% | -41% | 19% |
| Coldstream Homestead Montebello | 233 | 332 | 180 | 261 | 42% | -46% | 45% |
| Hamilton Hills | 209 | 281 | 203 | 237 | 34% | -28% | 17% |
| Carrollton Ridge | 185 | 271 | 278 | 211 | 46% | 3% | -24% |
| Baltimore Highlands | 163 | 259 | 158 | 118 | 59% | -39% | -25% |
| Broadway East | 231 | 258 | 232 | 192 | 12% | -10% | -17% |
| Mcelderry Park | 210 | 240 | 232 | 189 | 14% | -3% | -19% |
| Washington Village/Pigtown | 166 | 233 | 146 | 208 | 40% | -37% | 42% |
| East Baltimore Midway | 170 | 231 | 203 | 229 | 36% | -12% | 13% |
| Oliver | 164 | 226 | 189 | 146 | 38% | -16% | -23% |
| Mount Vernon | 135 | 224 | 207 | 165 | 66% | -8% | -20% |
| Mondawmin | 210 | 215 | 168 | 209 | 2% | -22% | 24% |
| Ellwood Park/Monument | 229 | 212 | 216 | 191 | -7% | 2% | -12% |
| Fells Point | 192 | 211 | 145 | 261 | 10% | -31% | 80% |
| Dunbar-Broadway | 158 | 206 | 163 | 148 | 30% | -21% | -9% |
| Morrell Park | 103 | 205 | 208 | 259 | 99% | 1% | 25% |
| Lakeland | 89 | 202 | 120 | 173 | 127% | -41% | 44% |
| Patterson Park Neighborhood | 204 | 200 | 99 | 147 | -2% | -50% | 48% |
| Curtis Bay | 117 | 197 | 113 | 163 | 68% | -43% | 44% |
| Harlem Park | 154 | 193 | 120 | 114 | 25% | -38% | -5% |
| Irvington | 97 | 181 | 179 | 157 | 87% | -1% | -12% |
| Canton | 174 | 173 | 104 | 171 | -1% | -40% | 64% |
| Franklin Square | 110 | 171 | 107 | 143 | 55% | -37% | 34% |
| Inner Harbor | 96 | 170 | 105 | 155 | 77% | -38% | 48% |
| Reservoir Hill | 168 | 169 | 143 | 190 | 1% | -15% | 33% |
| Penn North | 148 | 167 | 188 | 142 | 13% | 13% | -24% |
| Poppleton | 125 | 160 | 113 | 137 | 28% | -29% | 21% |
| Glenham-Belhar | 95 | 151 | 95 | 104 | 59% | -37% | 9% |
| Millhill | 97 | 151 | 129 | 106 | 56% | -15% | -18% |
| Berea | 93 | 149 | 149 | 149 | 60% | 0% | 0% |
| Penrose/Fayette Street Outreach | 148 | 145 | 165 | 158 | -2% | 14% | -4% |
| Charles North | 98 | 144 | 109 | 165 | 47% | -24% | 51% |
| Reisterstown Station | 92 | 144 | 119 | 164 | 57% | -17% | 38% |
| Rosemont | 83 | 144 | 141 | 106 | 73% | -2% | -25% |
| Allendale | 63 | 142 | 96 | 92 | 125% | -32% | -4% |
| Arlington | 88 | 142 | 99 | 127 | 61% | -30% | 28% |
| Oldtown | 124 | 141 | 133 | 158 | 14% | -6% | 19% |
| Hampden | 105 | 135 | 66 | 116 | 29% | -51% | 76% |
| Johnston Square | 77 | 132 | 80 | 78 | 71% | -39% | -2% |
| Woodmere | 84 | 128 | 123 | 107 | 52% | -4% | -13% |
| Charles Village | 103 | 127 | 85 | 126 | 23% | -33% | 48% |
| Carroll - Camden Industrial Area | 53 | 126 | 77 | 118 | 138% | -39% | 53% |
| Highlandtown | 120 | 124 | 98 | 121 | 3% | -21% | 23% |
| Howard Park | 82 | 124 | 102 | 112 | 51% | -18% | 10% |
| Waltherson | 81 | 124 | 99 | 96 | 53% | -20% | -3% |
| Shipley Hill | 81 | 123 | 72 | 100 | 52% | -41% | 39% |
| Barclay | 93 | 121 | 131 | 105 | 30% | 8% | -20% |
| Druid Heights | 72 | 120 | 71 | 92 | 67% | -41% | 30% |
| Ednor Gardens-Lakeside | 81 | 120 | 72 | 104 | 48% | -40% | 44% |
| Greektown | 98 | 120 | 88 | 103 | 22% | -27% | 17% |
| Waverly | 71 | 119 | 40 | 58 | 68% | -66% | 45% |
| Midtown-Edmondson | 85 | 116 | 59 | 70 | 36% | -49% | 19% |
| Coppin Heights/Ash-Co-East | 82 | 115 | 84 | 106 | 40% | -27% | 26% |
| New Southwest/Mount Clare | 84 | 115 | 99 | 99 | 37% | -14% | 0% |
| Pulaski Industrial Area | 90 | 114 | 122 | 170 | 27% | 7% | 39% |
| Madison-Eastend | 106 | 113 | 92 | 85 | 7% | -19% | -8% |
| Better Waverly | 125 | 110 | 97 | 137 | -12% | -12% | 41% |
| Gay Street | 113 | 110 | 95 | 103 | -3% | -14% | 8% |
| Jonestown | 58 | 109 | 102 | 88 | 88% | -6% | -14% |
| Hollins Market | 78 | 108 | 85 | 81 | 38% | -21% | -5% |
| Walbrook | 74 | 108 | 73 | 102 | 46% | -32% | 40% |
| Washington Hill | 96 | 107 | 69 | 111 | 11% | -36% | 61% |
| New Northwood | 77 | 106 | 102 | 136 | 38% | -4% | 33% |
| Greenmount West | 70 | 105 | 48 | 80 | 50% | -54% | 67% |
| Care | 52 | 104 | 61 | 62 | 100% | -41% | 2% |
| Northwest Community Action | 31 | 102 | 108 | 77 | 229% | 6% | -29% |
| Glen | 69 | 100 | 90 | 120 | 45% | -10% | 33% |
| Loch Raven | 85 | 97 | 97 | 131 | 14% | 0% | 35% |
| Madison Park | 102 | 97 | 82 | 110 | -5% | -15% | 34% |
| Mid-Town Belvedere | 80 | 97 | 82 | 116 | 21% | -15% | 41% |
| Bolton Hill | 63 | 96 | 86 | 121 | 52% | -10% | 41% |
| Hanlon-Longwood | 87 | 96 | 61 | 91 | 10% | -36% | 49% |
| Bridgeview/Greenlawn | 74 | 95 | 72 | 69 | 28% | -24% | -4% |
| Park Circle | 103 | 93 | 70 | 91 | -10% | -25% | 30% |
| Dorchester | 40 | 92 | 64 | 57 | 130% | -30% | -11% |
| Franklintown Road | 70 | 92 | 75 | 66 | 31% | -18% | -12% |
| Federal Hill | 117 | 90 | 58 | 145 | -23% | -36% | 150% |
| Edgewood | 48 | 89 | 90 | 63 | 85% | 1% | -30% |
| Milton-Montford | 86 | 86 | 87 | 75 | 0% | 1% | -14% |
| Upper Fells Point | 54 | 84 | 51 | 62 | 56% | -39% | 22% |
| Mosher | 68 | 83 | 52 | 52 | 22% | -37% | 0% |
| Perkins Homes | 61 | 83 | 34 | 15 | 36% | -59% | -56% |
| Clifton Park | 60 | 82 | 35 | 45 | 37% | -57% | 29% |
| Fallstaff | 52 | 81 | 62 | 74 | 56% | -23% | 19% |
| Old Goucher | 55 | 79 | 53 | 52 | 44% | -33% | -2% |
| Rosemont Homeowners/Tenants | 44 | 79 | 38 | 63 | 80% | -52% | 66% |
| North Harford Road | 67 | 78 | 48 | 79 | 16% | -38% | 65% |
| Riverside | 48 | 78 | 27 | 74 | 62% | -65% | 174% |
| University Of Maryland | 30 | 78 | 77 | 118 | 160% | -1% | 53% |
| Lauraville | 57 | 77 | 47 | 41 | 35% | -39% | -13% |
| Saint Josephs | 43 | 77 | 78 | 63 | 79% | 1% | -19% |
| Pen Lucy | 61 | 76 | 90 | 89 | 25% | 18% | -1% |
| Violetville | 53 | 73 | 85 | 106 | 38% | 16% | 25% |
| Armistead Gardens | 44 | 72 | 75 | 49 | 64% | 4% | -35% |
| Glen Oaks | 61 | 72 | 54 | 65 | 18% | -25% | 20% |
| Mount Holly | 53 | 72 | 67 | 50 | 36% | -7% | -25% |
| Abell | 56 | 71 | 29 | 61 | 27% | -59% | 110% |
| Greenspring | 69 | 68 | 81 | 88 | -1% | 19% | 9% |
| Middle East | 54 | 68 | 74 | 88 | 26% | 9% | 19% |
| Edmondson Village | 47 | 67 | 87 | 82 | 43% | 30% | -6% |
| Four By Four | 32 | 67 | 29 | 35 | 109% | -57% | 21% |
| Parkview/Woodbrook | 61 | 67 | 69 | 53 | 10% | 3% | -23% |
| Rognel Heights | 54 | 67 | 76 | 30 | 24% | 13% | -61% |
| Winchester | 28 | 67 | 58 | 42 | 139% | -13% | -28% |
| Cedmont | 36 | 66 | 64 | 44 | 83% | -3% | -31% |
| Graceland Park | 63 | 65 | 74 | 82 | 3% | 14% | 11% |
| Heritage Crossing | 36 | 65 | 36 | 34 | 81% | -45% | -6% |
| Remington | 60 | 65 | 51 | 63 | 8% | -22% | 24% |
| Westport | 43 | 65 | 64 | 99 | 51% | -2% | 55% |
| Butcher's Hill | 50 | 64 | 22 | 43 | 28% | -66% | 95% |
| Dolfield | 46 | 64 | 63 | 100 | 39% | -2% | 59% |
| Beechfield | 46 | 63 | 59 | 56 | 37% | -6% | -5% |
| Bayview | 49 | 62 | 87 | 73 | 27% | 40% | -16% |
| Boyd-Booth | 30 | 62 | 38 | 29 | 107% | -39% | -24% |
| Cylburn | 62 | 62 | 64 | 48 | 0% | 3% | -25% |
| South Clifton Park | 73 | 62 | 87 | 79 | -15% | 40% | -9% |
| Towanda-Grantley | 65 | 62 | 56 | 37 | -5% | -10% | -34% |
| Westgate | 58 | 62 | 61 | 48 | 7% | -2% | -21% |
| Seton Hill | 52 | 61 | 82 | 43 | 17% | 34% | -48% |
| Westfield | 48 | 61 | 69 | 51 | 27% | 13% | -26% |
| Harwood | 56 | 60 | 72 | 65 | 7% | 20% | -10% |
| Parkside | 47 | 60 | 48 | 47 | 28% | -20% | -2% |
| Penn-Fallsway | 50 | 60 | 45 | 27 | 20% | -25% | -40% |
| Union Square | 56 | 60 | 46 | 33 | 7% | -23% | -28% |
| Broening Manor | 40 | 59 | 44 | 67 | 48% | -25% | 52% |
| Downtown West | 55 | 59 | 53 | 73 | 7% | -10% | 38% |
| Patterson Place | 40 | 59 | 25 | 29 | 48% | -58% | 16% |
| Gwynns Falls | 20 | 58 | 98 | 60 | 190% | 69% | -39% |
| Wakefield | 37 | 58 | 46 | 26 | 57% | -21% | -43% |
| West Forest Park | 28 | 58 | 36 | 51 | 107% | -38% | 42% |
| Callaway-Garrison | 17 | 56 | 31 | 50 | 229% | -45% | 61% |
| Canton Industrial Area | 26 | 56 | 44 | 68 | 115% | -21% | 55% |
| Concerned Citizens Of Forest Park | 22 | 55 | 40 | 51 | 150% | -27% | 28% |
| Liberty Square | 44 | 53 | 56 | 56 | 20% | 6% | 0% |
| Cameron Village | 39 | 52 | 24 | 27 | 33% | -54% | 12% |
| Easterwood | 50 | 52 | 58 | 43 | 4% | 12% | -26% |
| Langston Hughes | 36 | 52 | 36 | 32 | 44% | -31% | -11% |
| Hopkins Bayview | 27 | 51 | 46 | 42 | 89% | -10% | -9% |
| Parklane | 57 | 50 | 72 | 39 | -12% | 44% | -46% |
| Carroll-South Hilton | 24 | 49 | 52 | 38 | 104% | 6% | -27% |
| Grove Park | 35 | 49 | 37 | 22 | 40% | -24% | -41% |
| Biddle Street | 52 | 48 | 46 | 51 | -8% | -4% | 11% |
| Orangeville | 18 | 47 | 24 | 21 | 161% | -49% | -12% |
| Cedonia | 41 | 46 | 53 | 55 | 12% | 15% | 4% |
| Yale Heights | 29 | 45 | 73 | 39 | 55% | 62% | -47% |
| Darley Park | 39 | 44 | 41 | 42 | 13% | -7% | 2% |
| Levindale | 32 | 44 | 51 | 60 | 38% | 16% | 18% |
| Pimlico Good Neighbors | 24 | 44 | 35 | 20 | 83% | -20% | -43% |
| East Arlington | 47 | 43 | 37 | 46 | -9% | -14% | 24% |
| Kresson | 29 | 43 | 29 | 29 | 48% | -33% | 0% |
| Ramblewood | 27 | 43 | 29 | 35 | 59% | -33% | 21% |
| Central Forest Park | 23 | 42 | 32 | 49 | 83% | -24% | 53% |
| Medford | 22 | 42 | 33 | 36 | 91% | -21% | 9% |
| O'donnell Heights | 38 | 42 | 52 | 67 | 11% | 24% | 29% |
| Forest Park | 41 | 40 | 39 | 47 | -2% | -2% | 21% |
| Ashburton | 47 | 39 | 32 | 41 | -17% | -18% | 28% |
| Fairmont | 41 | 39 | 7 | 14 | -5% | -82% | 100% |
| Fairfield Area | 25 | 38 | 24 | 11 | 52% | -37% | -54% |
| Hunting Ridge | 10 | 38 | 24 | 17 | 280% | -37% | -29% |
| Middle Branch/Reedbird Parks | 25 | 38 | 54 | 31 | 52% | 42% | -43% |
| Pleasant View Gardens | 56 | 38 | 53 | 42 | -32% | 39% | -21% |
| Homeland | 19 | 37 | 12 | 27 | 95% | -68% | 125% |
| South Baltimore | 25 | 37 | 21 | 43 | 48% | -43% | 105% |
| Winston-Govans | 34 | 37 | 40 | 42 | 9% | 8% | 5% |
| Mid-Govans | 37 | 36 | 44 | 34 | -3% | 22% | -23% |
| Oakenshawe | 19 | 36 | 20 | 7 | 89% | -44% | -65% |
| Perring Loch | 25 | 36 | 26 | 34 | 44% | -28% | 31% |
| Cross Country | 8 | 35 | 30 | 19 | 338% | -14% | -37% |
| Hillen | 28 | 35 | 22 | 40 | 25% | -37% | 82% |
| Cheswolde | 10 | 34 | 40 | 35 | 240% | 18% | -12% |
| Garwyn Oaks | 27 | 34 | 18 | 27 | 26% | -47% | 50% |
| Otterbein | 19 | 33 | 19 | 52 | 74% | -42% | 174% |
| Saint Agnes | 11 | 32 | 27 | 27 | 191% | -16% | 0% |
| West Arlington | 32 | 32 | 38 | 63 | 0% | 19% | 66% |
| Woodbourne Heights | 32 | 31 | 23 | 43 | -3% | -26% | 87% |
| Idlewood | 20 | 30 | 16 | 36 | 50% | -47% | 125% |
| Orchard Ridge | 31 | 30 | 18 | 34 | -3% | -40% | 89% |
| Rosemont East | 35 | 30 | 32 | 32 | -14% | 7% | 0% |
| Sharp-Leadenhall | 25 | 30 | 27 | 28 | 20% | -10% | 4% |
| Tremont | 7 | 30 | 16 | 20 | 329% | -47% | 25% |
| Brewers Hill | 27 | 29 | 10 | 56 | 7% | -66% | 460% |
| Radnor-Winston | 18 | 29 | 17 | 21 | 61% | -41% | 24% |
| Richnor Springs | 18 | 29 | 16 | 21 | 61% | -45% | 31% |
| Burleith-Leighton | 17 | 27 | 16 | 19 | 59% | -41% | 19% |
| Coldspring | 10 | 27 | 16 | 16 | 170% | -41% | 0% |
| Kenilworth Park | 20 | 27 | 15 | 24 | 35% | -44% | 60% |
| Ridgely's Delight | 11 | 27 | 11 | 23 | 145% | -59% | 109% |
| Franklintown | 21 | 26 | 29 | 32 | 24% | 12% | 10% |
| Guilford | 16 | 26 | 9 | 16 | 62% | -65% | 78% |
| Lower Edmondson Village | 7 | 26 | 13 | 15 | 271% | -50% | 15% |
| Morgan State University | 11 | 25 | 26 | 13 | 127% | 4% | -50% |
| Mount Washington | 13 | 25 | 24 | 13 | 92% | -4% | -46% |
| Saint Helena | 12 | 25 | 18 | 25 | 108% | -28% | 39% |
| Little Italy | 19 | 24 | 19 | 32 | 26% | -21% | 68% |
| Stadium Area | 18 | 24 | 6 | 32 | 33% | -75% | 433% |
| Lucille Park | 21 | 23 | 31 | 25 | 10% | 35% | -19% |
| West Hills | 13 | 23 | 18 | 28 | 77% | -22% | 56% |
| Woodbourne-Mccabe | 24 | 23 | 28 | 20 | -4% | 22% | -29% |
| Wyman Park | 13 | 23 | 9 | 20 | 77% | -61% | 122% |
| Roland Park | 17 | 22 | 23 | 14 | 29% | 5% | -39% |
| Ten Hills | 13 | 22 | 37 | 18 | 69% | 68% | -51% |
| Uplands | 20 | 22 | 13 | 11 | 10% | -41% | -15% |
| Evergreen Lawn | 18 | 21 | 18 | 22 | 17% | -14% | 22% |
| Oaklee | 2 | 21 | 13 | 11 | 950% | -38% | -15% |
| Seton Business Park | 8 | 21 | 17 | 29 | 162% | -19% | 71% |
| Stonewood-Pentwood-Winston | 12 | 21 | 11 | 13 | 75% | -48% | 18% |
| Locust Point | 18 | 20 | 4 | 12 | 11% | -80% | 200% |
| Mount Winans | 18 | 20 | 18 | 19 | 11% | -10% | 6% |
| Patterson Park | 26 | 20 | 9 | 16 | -23% | -55% | 78% |
| Wilson Park | 16 | 20 | 10 | 24 | 25% | -50% | 140% |
| Panway/Braddish Avenue | 25 | 19 | 16 | 50 | -24% | -16% | 212% |
| Rosebank | 20 | 19 | 13 | 20 | -5% | -32% | 54% |
| Woodberry | 21 | 19 | 83 | 36 | -10% | 337% | -57% |
| Mayfield | 8 | 18 | 9 | 9 | 125% | -50% | 0% |
| Original Northwood | 13 | 18 | 12 | 8 | 38% | -33% | -33% |
| Windsor Hills | 25 | 18 | 23 | 36 | -28% | 28% | 57% |
| Arcadia | 23 | 17 | 20 | 16 | -26% | 18% | -20% |
| Chinquapin Park | 20 | 17 | 20 | 14 | -15% | 18% | -30% |
| Lake Walker | 24 | 17 | 20 | 23 | -29% | 18% | 15% |
| Orangeville Industrial Area | 10 | 17 | 10 | 12 | 70% | -41% | 20% |
| Wilhelm Park | 10 | 17 | 23 | 13 | 70% | 35% | -43% |
| Carroll Park | 17 | 16 | 9 | 18 | -6% | -44% | 100% |
| Druid Hill Park | 5 | 16 | 13 | 26 | 220% | -19% | 100% |
| Morgan Park | 3 | 16 | 1 | 1 | 433% | -94% | 0% |
| Belvedere | 7 | 15 | 16 | 13 | 114% | 7% | -19% |
| Medfield | 23 | 15 | 19 | 46 | -35% | 27% | 142% |
| Moravia-Walther | 4 | 15 | 16 | 8 | 275% | 7% | -50% |
| Kernewood | 4 | 14 | 5 | 10 | 250% | -64% | 100% |
| Hoes Heights | 9 | 13 | 5 | 14 | 44% | -62% | 180% |
| Evesham Park | 13 | 12 | 6 | 7 | -8% | -50% | 17% |
| Montebello | 14 | 12 | 9 | 9 | -14% | -25% | 0% |
| Wrenlane | 9 | 12 | 23 | 19 | 33% | 92% | -17% |
| Belair-Parkside | 22 | 11 | 20 | 8 | -50% | 82% | -60% |
| Overlea | 3 | 11 | 6 | 9 | 267% | -45% | 50% |
| Tuscany-Canterbury | 6 | 11 | 5 | 8 | 83% | -55% | 60% |
| Beverly Hills | 5 | 10 | 4 | 1 | 100% | -60% | -75% |
| Locust Point Industrial Area | 6 | 10 | 7 | 10 | 67% | -30% | 43% |
| Jones Falls Area | 10 | 9 | 4 | 13 | -10% | -56% | 225% |
| Purnell | 5 | 9 | 7 | 10 | 80% | -22% | 43% |
| Herring Run Park | 7 | 8 | 5 | 1 | 14% | -38% | -80% |
| Wyndhurst | 6 | 8 | 5 | 8 | 33% | -38% | 60% |
| Cedarcroft | 3 | 7 | 3 | 6 | 133% | -57% | 100% |
| Cross Keys | 15 | 7 | 7 | 10 | -53% | 0% | 43% |
| Barre Circle | 10 | 6 | 10 | 3 | -40% | 67% | -70% |
| Eastwood | 9 | 6 | 11 | 12 | -33% | 83% | 9% |
| Gwynns Falls/Leakin Park | 3 | 6 | 8 | 6 | 100% | 33% | -25% |
| Holabird Industrial Park | 4 | 6 | 2 | 2 | 50% | -67% | 0% |
| Dickeyville | 1 | 5 | 2 | 3 | 400% | -60% | 50% |
| Lake Evesham | 6 | 4 | 4 | 2 | -33% | 0% | -50% |
| North Roland Park/Poplar Hill | 4 | 4 | 14 | 15 | 0% | 250% | 7% |
| Spring Garden Industrial Area | 1 | 4 | 3 | 5 | 300% | -25% | 67% |
| Evergreen | 4 | 3 | 4 | 6 | -25% | 33% | 50% |
| Forest Park Golf Course | 7 | 3 | 1 | 2 | -57% | -67% | 100% |
| Lower Herring Run Park | 2 | 3 | 6 | 5 | 50% | 100% | -17% |
| York-Homeland | 9 | 3 | 8 | 32 | -67% | 167% | 300% |
| Johns Hopkins Homewood | 5 | 2 | 6 | 7 | -60% | 200% | 17% |
| Loyola/Notre Dame | 5 | 2 | 5 | -60% | |||
| Mt Pleasant Park | 1 | 2 | 1 | 3 | 100% | -50% | 200% |
| Taylor Heights | 1 | 2 | 4 | 5 | 100% | 100% | 25% |
| Bellona-Gittings | 2 | 1 | -50% | ||||
| Greenmount Cemetery | 3 | 1 | 1 | -67% | 0% | ||
| Hawkins Point | 1 | 1 | 6 | 5 | 0% | 500% | -17% |
| Keswick | 2 | 1 | 1 | -50% | |||
| Sabina-Mattfeldt | 6 | 1 | 1 | 3 | -83% | 0% | 200% |
| Saint Paul | 2 | 1 | 1 | 7 | -50% | 0% | 600% |
| The Orchards | 1 | 1 | 1 | 0% | |||
| Port Covington | 5 | 3 |
All crimes in the neighborhoods, year 2014, 2017, 2020 and 2022
Downtown Baltimore tops the list with most crimes by count in each of these years, but the % change is modest; crime rose 13% from 2014 to ’17, fell 6% from 2017 to ’20, then rose by 25% over ’20-’22. In comparison, every other neighborhood in the top 10 has experienced much bigger swings in crime activity; for example, Brooklyn saw 101% rise in violent crimes, followed by 41% drop, followed by 23% rise.
Table below shows a breakdown of crime activity by types in the neighborhoods for year 2022.
| Neighborhood | Assault | Robbery | Shooting | Homicide | Rape |
|---|---|---|---|---|---|
| Downtown | 582 | 202 | 11 | 4 | 13 |
| Frankford | 348 | 100 | 20 | 10 | 3 |
| Belair-Edison | 304 | 89 | 19 | 6 | 7 |
| Upton | 286 | 51 | 23 | 2 | 3 |
| Brooklyn | 278 | 75 | 26 | 9 | 2 |
| Sandtown-Winchester | 273 | 29 | 17 | 6 | 7 |
| Cherry Hill | 246 | 29 | 11 | 7 | 4 |
| Coldstream Homestead Montebello | 201 | 36 | 11 | 9 | 4 |
| Hamilton Hills | 194 | 32 | 5 | 4 | 2 |
| Morrell Park | 191 | 53 | 10 | 2 | 3 |
| Fells Point | 184 | 64 | 5 | 3 | 5 |
| Central Park Heights | 171 | 39 | 15 | 9 | 4 |
| Reservoir Hill | 155 | 27 | 4 | 2 | 2 |
| East Baltimore Midway | 151 | 61 | 11 | 2 | 4 |
| Mondawmin | 150 | 49 | 6 | 3 | 1 |
| Washington Village/Pigtown | 148 | 49 | 9 | 2 | |
| Broadway East | 142 | 35 | 8 | 6 | 1 |
| Carrollton Ridge | 142 | 35 | 19 | 15 | |
| Mcelderry Park | 141 | 27 | 14 | 2 | 5 |
| Ellwood Park/Monument | 134 | 36 | 13 | 4 | 4 |
| Curtis Bay | 132 | 22 | 4 | 2 | 3 |
| Oldtown | 123 | 22 | 8 | 3 | 2 |
| Pulaski Industrial Area | 121 | 39 | 3 | 2 | 5 |
| Inner Harbor | 119 | 29 | 3 | 1 | 3 |
| Irvington | 119 | 24 | 8 | 4 | 2 |
| Poppleton | 117 | 8 | 9 | 2 | 1 |
| Canton | 116 | 49 | 4 | 1 | 1 |
| Charles North | 115 | 46 | 4 | ||
| Franklin Square | 115 | 22 | 3 | 3 | |
| Lakeland | 115 | 41 | 7 | 6 | 4 |
| Mount Vernon | 113 | 46 | 3 | 3 | |
| Berea | 112 | 17 | 11 | 4 | 5 |
| Penn North | 109 | 18 | 10 | 3 | 2 |
| Dunbar-Broadway | 106 | 18 | 17 | 4 | 3 |
| Loch Raven | 104 | 19 | 7 | 1 | |
| Federal Hill | 101 | 42 | 2 | ||
| Penrose/Fayette Street Outreach | 101 | 44 | 10 | 2 | 1 |
| Better Waverly | 98 | 34 | 1 | 1 | 3 |
| Harlem Park | 98 | 11 | 2 | 2 | 1 |
| Patterson Park Neighborhood | 96 | 47 | 3 | 1 | |
| Rosemont | 95 | 9 | 1 | 1 | |
| Oliver | 94 | 35 | 10 | 5 | 2 |
| Reisterstown Station | 92 | 65 | 4 | 1 | 2 |
| Violetville | 91 | 9 | 4 | 1 | 1 |
| Howard Park | 90 | 17 | 1 | 3 | 1 |
| Arlington | 89 | 21 | 8 | 8 | 1 |
| Allendale | 88 | 2 | 1 | 1 | |
| Carroll - Camden Industrial Area | 86 | 26 | 3 | 3 | |
| New Northwood | 84 | 48 | 3 | 1 | |
| Greektown | 83 | 18 | 1 | 1 | |
| Coppin Heights/Ash-Co-East | 82 | 15 | 6 | 2 | 1 |
| Hanlon-Longwood | 82 | 7 | 1 | 1 | |
| Baltimore Highlands | 81 | 29 | 4 | 2 | 2 |
| Charles Village | 81 | 39 | 1 | 1 | 4 |
| Glenham-Belhar | 81 | 19 | 2 | 1 | 1 |
| Millhill | 81 | 18 | 4 | 3 | |
| Westport | 79 | 15 | 4 | 1 | |
| University Of Maryland | 78 | 26 | 8 | 3 | 3 |
| Madison Park | 77 | 28 | 5 | ||
| Mid-Town Belvedere | 77 | 36 | 3 | ||
| Shipley Hill | 77 | 12 | 6 | 4 | 1 |
| Edmondson Village | 76 | 4 | 1 | 1 | |
| Gay Street | 74 | 15 | 10 | 4 | |
| Madison-Eastend | 74 | 4 | 4 | 3 | |
| Barclay | 73 | 20 | 7 | 2 | 3 |
| Ednor Gardens-Lakeside | 73 | 25 | 2 | 2 | 2 |
| New Southwest/Mount Clare | 73 | 18 | 3 | 5 | |
| Waltherson | 73 | 20 | 1 | 1 | 1 |
| Greenspring | 72 | 10 | 2 | 3 | 1 |
| Pen Lucy | 71 | 13 | 2 | 2 | 1 |
| Glen | 70 | 38 | 5 | 3 | 4 |
| Jonestown | 67 | 17 | 2 | 1 | 1 |
| Dolfield | 66 | 31 | 3 | ||
| Druid Heights | 66 | 19 | 5 | 2 | |
| Highlandtown | 66 | 54 | 1 | ||
| Park Circle | 66 | 18 | 3 | 2 | 2 |
| Middle East | 65 | 22 | 1 | ||
| O'donnell Heights | 64 | 1 | 1 | 1 | |
| Johnston Square | 63 | 8 | 5 | 2 | |
| Washington Hill | 63 | 43 | 1 | 2 | 2 |
| Greenmount West | 62 | 17 | 1 | ||
| Walbrook | 62 | 25 | 7 | 4 | 4 |
| Bayview | 61 | 11 | 1 | ||
| Fallstaff | 60 | 12 | 1 | 1 | |
| Hampden | 60 | 49 | 6 | 1 | |
| Northwest Community Action | 59 | 11 | 6 | 1 | |
| Woodmere | 59 | 38 | 8 | 1 | 1 |
| Graceland Park | 57 | 24 | 1 | ||
| Broening Manor | 56 | 6 | 4 | 1 | |
| Hollins Market | 56 | 22 | 1 | 2 | |
| Midtown-Edmondson | 56 | 10 | 4 | ||
| North Harford Road | 56 | 22 | 1 | ||
| Downtown West | 55 | 18 | |||
| Bolton Hill | 54 | 66 | 1 | ||
| Franklintown Road | 54 | 6 | 4 | 2 | |
| Edgewood | 52 | 5 | 2 | 4 | |
| Bridgeview/Greenlawn | 51 | 14 | 1 | 2 | 1 |
| Glen Oaks | 51 | 13 | 1 | ||
| West Arlington | 51 | 6 | 2 | 2 | 2 |
| Rosemont Homeowners/Tenants | 50 | 8 | 5 | ||
| Saint Josephs | 50 | 2 | 6 | 4 | 1 |
| South Clifton Park | 50 | 16 | 7 | 6 | |
| Care | 49 | 11 | 1 | 1 | |
| Dorchester | 49 | 5 | 2 | 1 | |
| Milton-Montford | 49 | 7 | 12 | 6 | 1 |
| Waverly | 49 | 8 | 1 | ||
| Canton Industrial Area | 48 | 20 | |||
| Gwynns Falls | 48 | 9 | 1 | 2 | |
| Harwood | 48 | 14 | 3 | ||
| Levindale | 48 | 8 | 1 | 3 | |
| Beechfield | 43 | 10 | 1 | 1 | 1 |
| Concerned Citizens Of Forest Park | 43 | 7 | 1 | ||
| Upper Fells Point | 43 | 19 | |||
| Cedonia | 42 | 9 | 2 | 1 | 1 |
| Cylburn | 42 | 4 | 1 | 1 | |
| West Forest Park | 42 | 7 | 1 | 1 | |
| Biddle Street | 41 | 7 | 3 | ||
| Parkview/Woodbrook | 41 | 8 | 1 | 3 | |
| Westgate | 41 | 7 | |||
| Callaway-Garrison | 40 | 10 | |||
| Mount Holly | 40 | 9 | 1 | ||
| Liberty Square | 39 | 13 | 3 | 1 | |
| Remington | 39 | 24 | |||
| Mosher | 38 | 11 | 2 | 1 | |
| Forest Park | 37 | 5 | 1 | 4 | |
| East Arlington | 36 | 8 | 2 | ||
| Riverside | 36 | 37 | 1 | ||
| Yale Heights | 36 | 2 | 1 | ||
| Darley Park | 35 | 2 | 3 | 1 | 1 |
| Easterwood | 35 | 5 | 1 | 2 | |
| Parkside | 35 | 10 | 2 | ||
| Pleasant View Gardens | 35 | 6 | 1 | ||
| Hopkins Bayview | 34 | 4 | 2 | 2 | |
| Parklane | 34 | 4 | 1 | ||
| Medford | 33 | 2 | 1 | ||
| Ramblewood | 33 | 2 | |||
| Winchester | 33 | 5 | 3 | 1 | |
| Central Forest Park | 32 | 13 | 1 | 3 | |
| Clifton Park | 32 | 12 | 1 | ||
| Medfield | 32 | 12 | 1 | 1 | |
| Armistead Gardens | 31 | 18 | |||
| Brewers Hill | 31 | 23 | 2 | ||
| Old Goucher | 31 | 20 | 1 | ||
| Panway/Braddish Avenue | 31 | 17 | 2 | ||
| Seton Hill | 31 | 10 | 2 | ||
| Abell | 30 | 31 | |||
| Heritage Crossing | 30 | 1 | 2 | 1 | |
| Lauraville | 30 | 11 | |||
| Otterbein | 30 | 17 | 1 | 3 | 1 |
| Winston-Govans | 30 | 11 | 1 | ||
| Carroll-South Hilton | 29 | 6 | 2 | 1 | |
| Four By Four | 29 | 6 | |||
| Windsor Hills | 29 | 5 | 2 | ||
| Woodbourne Heights | 29 | 11 | 2 | 1 | |
| Boyd-Booth | 28 | 1 | |||
| Cedmont | 28 | 15 | 1 | ||
| Hillen | 28 | 7 | 2 | 3 | |
| Idlewood | 28 | 7 | 1 | ||
| Mid-Govans | 28 | 4 | 2 | ||
| Cheswolde | 27 | 8 | |||
| Penn-Fallsway | 27 | ||||
| Franklintown | 26 | 5 | 1 | ||
| Middle Branch/Reedbird Parks | 26 | 3 | 1 | 1 | |
| Cameron Village | 25 | 2 | |||
| Rosemont East | 25 | 6 | 1 | ||
| Stadium Area | 25 | 7 | |||
| Union Square | 25 | 6 | 2 | ||
| Rognel Heights | 24 | 4 | 1 | 1 | |
| South Baltimore | 24 | 18 | 1 | ||
| Wakefield | 24 | 1 | 1 | ||
| West Hills | 24 | 3 | 1 | ||
| Homeland | 23 | 3 | 1 | ||
| Kresson | 23 | 6 | |||
| Saint Helena | 23 | 2 | |||
| Westfield | 23 | 25 | 1 | 1 | 1 |
| Saint Agnes | 22 | 5 | |||
| York-Homeland | 22 | 10 | |||
| Lucille Park | 21 | 2 | 2 | ||
| Seton Business Park | 21 | 7 | 1 | ||
| Ashburton | 20 | 18 | 2 | 1 | |
| Langston Hughes | 20 | 6 | 5 | 1 | |
| Orchard Ridge | 20 | 11 | 2 | 1 | |
| Perring Loch | 20 | 14 | |||
| Towanda-Grantley | 20 | 4 | 10 | 2 | 1 |
| Butcher's Hill | 19 | 22 | 2 | ||
| Garwyn Oaks | 19 | 4 | 1 | 3 | |
| Tremont | 19 | 1 | |||
| Evergreen Lawn | 18 | 2 | 2 | ||
| Kenilworth Park | 18 | 5 | 1 | ||
| Patterson Place | 18 | 10 | 1 | ||
| Rosebank | 18 | 2 | |||
| Sharp-Leadenhall | 18 | 7 | 2 | 1 | |
| Wilson Park | 18 | 4 | 1 | 1 | |
| Woodbourne-Mccabe | 18 | 1 | 1 | ||
| Little Italy | 17 | 13 | 1 | 1 | |
| Radnor-Winston | 17 | 4 | |||
| Richnor Springs | 17 | 2 | 1 | 1 | |
| Woodberry | 17 | 14 | 2 | 3 | |
| Cross Country | 16 | 3 | |||
| Ten Hills | 16 | 2 | |||
| Wrenlane | 15 | 3 | 1 | ||
| Pimlico Good Neighbors | 14 | 2 | 3 | 1 | |
| Coldspring | 13 | 3 | |||
| Druid Hill Park | 13 | 11 | 1 | 1 | |
| Grove Park | 13 | 7 | 2 | ||
| Hunting Ridge | 13 | 3 | 1 | ||
| Lake Walker | 13 | 9 | 1 | ||
| Orangeville | 13 | 7 | 1 | ||
| Arcadia | 12 | 3 | 1 | ||
| Fairmont | 12 | 2 | |||
| Carroll Park | 11 | 6 | 1 | ||
| Eastwood | 11 | 1 | |||
| Locust Point | 11 | 1 | |||
| Lower Edmondson Village | 11 | 4 | |||
| Mount Winans | 11 | 4 | 3 | 1 | |
| Burleith-Leighton | 10 | 7 | 2 | ||
| Chinquapin Park | 10 | 4 | |||
| Jones Falls Area | 10 | 3 | |||
| Mount Washington | 10 | 2 | 1 | ||
| Ridgely's Delight | 10 | 13 | |||
| Guilford | 9 | 6 | 1 | ||
| Oaklee | 9 | 1 | 1 | ||
| Wilhelm Park | 9 | 2 | 1 | 1 | |
| Hoes Heights | 8 | 6 | |||
| Overlea | 8 | 1 | |||
| Perkins Homes | 8 | 6 | 1 | ||
| Purnell | 8 | 2 | |||
| Stonewood-Pentwood-Winston | 8 | 3 | 1 | 1 | |
| Uplands | 8 | 2 | 1 | ||
| Belair-Parkside | 7 | 1 | |||
| Belvedere | 7 | 5 | 1 | ||
| Cross Keys | 7 | 1 | 2 | ||
| Fairfield Area | 7 | 1 | 1 | 2 | |
| Kernewood | 7 | 1 | 1 | 1 | |
| Morgan State University | 7 | 3 | 2 | 1 | |
| North Roland Park/Poplar Hill | 7 | 8 | |||
| Saint Paul | 7 | ||||
| Johns Hopkins Homewood | 6 | 1 | |||
| Locust Point Industrial Area | 6 | 4 | |||
| Montebello | 6 | 3 | |||
| Roland Park | 6 | 8 | |||
| Wyman Park | 6 | 14 | |||
| Wyndhurst | 6 | 2 | |||
| Evesham Park | 5 | 2 | |||
| Hawkins Point | 5 | ||||
| Moravia-Walther | 5 | 2 | 1 | ||
| Oakenshawe | 5 | 1 | 1 | ||
| Orangeville Industrial Area | 5 | 5 | 2 | ||
| Original Northwood | 5 | 3 | |||
| Patterson Park | 5 | 10 | 1 | ||
| Taylor Heights | 5 | ||||
| Tuscany-Canterbury | 5 | 3 | |||
| Barre Circle | 3 | ||||
| Cedarcroft | 3 | 3 | |||
| Dickeyville | 3 | ||||
| Mayfield | 3 | 6 | |||
| Forest Park Golf Course | 2 | ||||
| Holabird Industrial Park | 2 | ||||
| Lake Evesham | 2 | ||||
| Lower Herring Run Park | 2 | 3 | |||
| Loyola/Notre Dame | 2 | 3 | |||
| Port Covington | 2 | 1 | |||
| Sabina-Mattfeldt | 2 | 1 | |||
| Spring Garden Industrial Area | 2 | 3 | |||
| Beverly Hills | 1 | ||||
| Evergreen | 1 | 5 | |||
| Gwynns Falls/Leakin Park | 1 | 2 | 1 | 2 | |
| Herring Run Park | 1 | ||||
| Keswick | 1 | ||||
| Morgan Park | 1 | ||||
| Villages Of Homeland | 1 | ||||
| Mt Pleasant Park | 3 | ||||
| The Orchards | 1 |
Neighborhood crime by type, year 2022
As expected, downtown again tops the list in assault, robbery and rape. By contrast, Brooklyn reported most shooting incidents and Carrollton Ridge most homicides in 2022.
Visualizing crime distribution:
Often a better way to visualize spatially distributed crime data is by plotting the data points at the exact locations – streets, houses, parking lots – where the crimes occur. The images below are created by overlaying each and every crime incidence, represented by a colored dot for a particular type of crime, on the Baltimore city street map for the year 2014, 2017 and 2022.

There were more assaults (yellow) and robberies (red) throughout much of the city area in 2017 compared to both 2014 and 2022, as expected. We can get a close-up view by zooming in on a street or a neighborhood; the Brooklyn neighborhood that recorded large highs and lows noted in the table above is shown here.
Another way to view spatial data that may offer clarity is by comparing heatmaps of overall crime distribution, as shown below. These are hotspots marking locations of high crime activity within the city, generated by overlaying filled contour plots of different intensity levels on the city map. It is now easier to find areas that have seen more or less crime in any given year (for example Brooklyn).

One thing that is evident from these spatial plots is that the distribution of crime is not homogeneous in space; instead different types of crime are generally clustered in different areas of the city. In the next post I talk about how to exploit these clustering patterns, or “spatial correlations”, that can be used to develop predictive models.

Hi there! I am Roy, founder of Quantiux and author of everything you see here. I am a data scientist, with a deep interest in playing with data of all colors, shapes and sizes. I also enjoy coding anything that catches my fancy.
Leave a comment below if this article interests you, or contact me for any general comment/question.