Hello and welcome!
Quantiux, or quantitative redux, is a blog about data science, where the author attempts to do a quantitative reduction of all kinds of data. Reductionism is defined as “a procedure or theory that reduces complex data and phenomena to simple terms”, and quantitative analysis involves applying mathematical, statistical and computational tools to understanding real-life problems often presented as data.
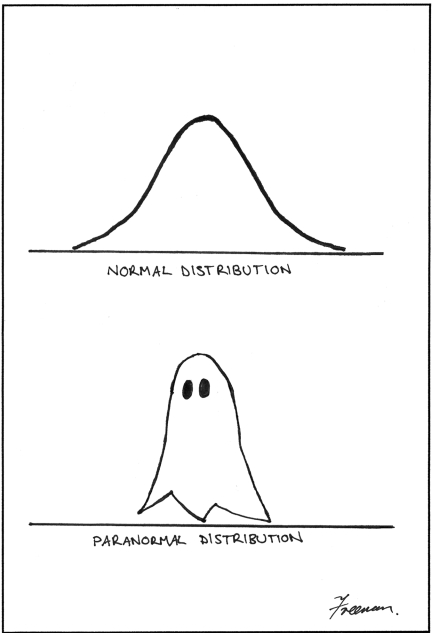
Although the analysis is necessarily quantitative, data itself can be both quantitative, expressed by measuring some quantity in numbers (height, volume, price), and qualitative, expressed in descriptive terms without numbers (colors, emotions, flavors). As every data scientist knows, the process of extracting meaningful information from raw data is often a battle of attrition, littered with false steps, trials and tribulations. This is not unlike the sentiment expressed by Matthew Freeman when he notes he has no idea where the paranormal distribution in the bottom left picture is coming from.
Here you will get an unvarnished take of the author’s journey as he struggles with real-world data from the beginning steps to conclusion. The main programming languages used are Python and R, easily among the top choices for data scientists.
You will also find off-topic posts about interesting and useful projects that the author comes across in his daily work and life; hopefully they will be interesting to you too. Thanks for visiting, and happy browsing!

Hi there! I am Roy, founder of Quantiux and author of everything you see here. I am a data scientist, with a deep interest in playing with data of all colors, shapes and sizes. I also enjoy coding anything that catches my fancy.
Feel free to contact me if you have any comment or question.
